Byron Donaldson
Biomechanist | Exploring | Cincinnati, OH
Making an interactive running map
Last map update: Nov 2024
“A race? You’ve lost your mind! Jogging is private, you don’t jog for an audience."
Cop 223, Chungking Express
I have, by now, been running for almost 6 years, cosying up to 17 000 kms. One of the treats of running is as an act of exploration. To explore on foot places you are visiting, a reason to go to a particular place, and to explore closer to home - the area you live. But now I also am a big old fan of maps, especially satellite numbers, so I wanted to try plot a heatmap sort of thing from all the many running routes new and repeated, and since I am not a Strava man I figured I’d try do it in R as a bit of a learning project.
As it happens, getting all my .gpx and route and workout files from the many different places I had recorded them over the years (Notebooks, MapMyRun, TomTom, Suunto, and so on) was rather difficult. Each platform has its own challenges, but the main one is that they don’t like to allow you to mass export your files from their platforms. I know there are webscraping and API yada yadas that you can do this with but most of the guides I found to navigate all that were older and no longer on the money or way above my peanut brain and I didn’t ever manage to get them working. So I settled for a nice little app called Health Sync which more or less slowly worked through all my files on each different platform, exporting them to a Google Drive backup.
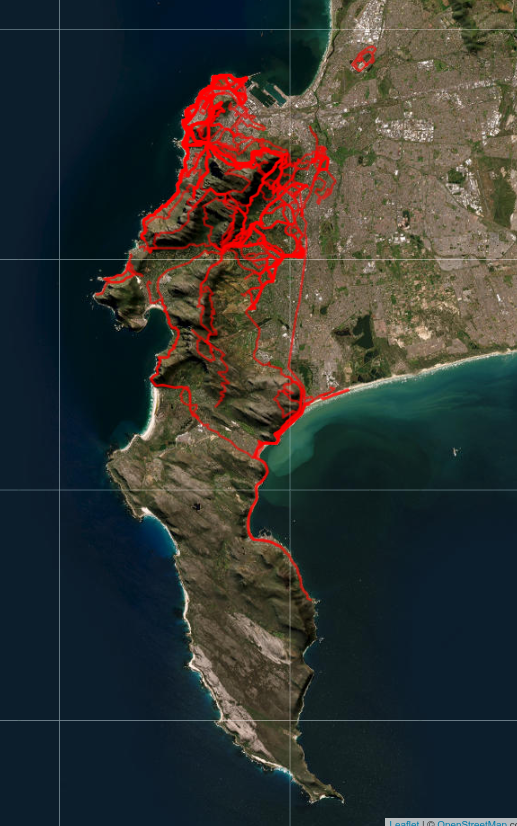
So well since I had files from a few different places and formats etc I just did the simplest thing for my purposes which was to extract the latitude and longitude for each run with a token ID marker (data). It turns out the map code itself was fairly simple in either R or Python (code for both here) with leaflet and folium. I doubt my silly ass found the optimum solution but it worked well enough to load a base map projection (I like satellite maps so Esri.WorldImagery is a treat, but there are a bunch available. See https://leaflet-extras.github.io/leaflet-providers/preview/) and then use a simple for loop to add all the running routes and export the map as an html. With the number of data points getting a little high (> 3 milion) the main obstacle was actually just the processing speed and keeping my little old laptop from crashing, which Python seemed to handle a little better. Well but it is also true that for simple route plotting you don’t really need the high sampling rates in the GPX files, so you can improve the speed and computational instensity and all that by just taking like every tenth frame which makes life substantially easier.
Of course, leaflet and folium can add points and markers and tooltips and so on but for my purposes for the time being that was all a little unnecessary. So it goes.
Anyways, look, a map with all the routes my feet have had the privilege (full screen map here: